|
This is a simple application to give users the opportunity to rate your site and displays results in the form of bar charts (no graphics included).
The source code contains a flexible configurable database.
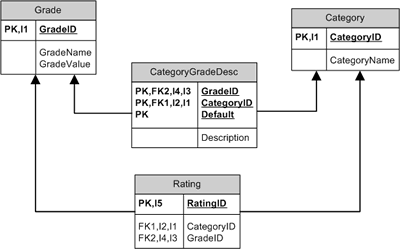
The application's database is made up of four tables:
-
Category: The table that contains the website rating categories such as Content,
Authority...etc
-
Grade:
The grades or values that can be given to each category e.g. A, B, or C
-
CategoryGradeDesc:
This table holds the description for each category's grade value and a default
grade value for the category.
-
Rating: This is the table that users will update by rating your site.
The database tables relationship can be seen in the figure below:

Tables Relationship
Users submit a Category and a Grade which are then inserted into
the rating table as shown in the script below:
INSERT INTO Rating(CategoryID, GradeID)
VALUES(@CategoryID, @GradeID)
These grade values are then tallied against their counts to generate bar charts
that relay the site rating for the given category as shown in the code below:
Sub DrawChart
Dim RS,SQL
'Set your SQL statement - use stored
procedure if possible
SQL = " SELECT Rating.CategoryID,
Category.CategoryName, Sum(Grade.GradeValue) AS [Sum], Count(Rating.CategoryID)
AS [Count], Max(Grade.GradeValue) AS [Max]"
SQL = SQL & "
FROM Grade INNER JOIN (Category INNER JOIN Rating ON Category.CategoryID =
Rating.CategoryID) ON Grade.GradeID = Rating.GradeID"
SQL = SQL & "
GROUP BY Rating.CategoryID, Category.CategoryName"
SQL = SQL & "
ORDER BY Rating.CategoryID;"
Set RS = Conn.Execute(SQL)
If RS.EOF Then
'No records
returned
Response.Write("No
rating available.")
Else
Response.Write("<table
border=0 width=300>")
Do
While Not RS.EOF
'For
each category, draw a bar chart
Call
DrawCategory(RS("CategoryName"),RS("Sum"),RS("Count")
* RS("Max"))
RS.MoveNext
Loop
Response.Write("<tr><td> </td><td
align=right>")
'Add a simple scale
Response.Write("<table
width=""100%"" cellpadding=0
cellspacing=0><tr>")
Response.Write("<td
align=left><font size=1 face=arial>0</td>")
Response.Write("<td
align=right><font size=1 face=arial>100%</td>")
Response.Write("</table>")
Response.Write("</td></tr>")
Response.Write("</table>")
RS.Close
End If
Set RS = Nothing
End Sub
Sub DrawCategory(strName,intValue,intMax)
'Write category name and percentage
Response.Write("<tr><td
nowrap>" & strName & _
" (<font size=1
face=arial>" & _
CInt((intValue/intMax)*100) & _
"%)</td><td
bgcolor=black width=""99%"">")
'Draw bar chart
DrawBar(CInt((intValue/intMax)*100))
Response.Write("</td></tr>")
End Sub
Sub DrawBar(intPercentage)
Response.Write("<table width=""100%""
cellpadding=0 cellspacing=0><tr>")
Response.Write("<td bgcolor=purple
title=""" & _
intPercentage &
"%"" width=""" &
intPercentage & _
"%""> </td>")
Response.Write("<td bgcolor=yellow
width=""" & _
(100-intPercentage) & "%""> </td>")
Response.Write("</table>")
End Sub
The rating system will display results similar to those shown in the figure below:

Rating System Results


